

Taking a More Analytic Approach to Wordle
The hottest online game of January 2022 is Wordle, a deceptively addictive online game where one tries to guess a five-letter word starting from scratch. Perhaps you’ve started seeing a lot of posts that look like this:
In the unlikely case you haven’t tried Wordle out yet, let me help enable you with this link: https://www.powerlanguage.co.uk/wordle/
OK, that said, the rules of this game are fairly simple: you have six chances to guess the word of the day. This game, created by software developer Josh Wardle, was adorably created as a game for his partner to enjoy. But its simplicity has made it a welcome online escape in the New Year. The website isn’t trying to sell you anything. It isn’t designed to “go viral.” All it does is ask you to guess a word.
But for those who have played the game, the question quickly comes up on how to play this game better. Are there quantitative tricks that can be used to make our Wordle attempts more efficient? How do we avoid that stressful sixth try where the attempt is “do or die?”
For the purposes of this blog, we will not be going directly into any direct Wordle sources because what fun would that be?
Here’s a few tips for Wordle based on some basic analytic data problem solving strategies.
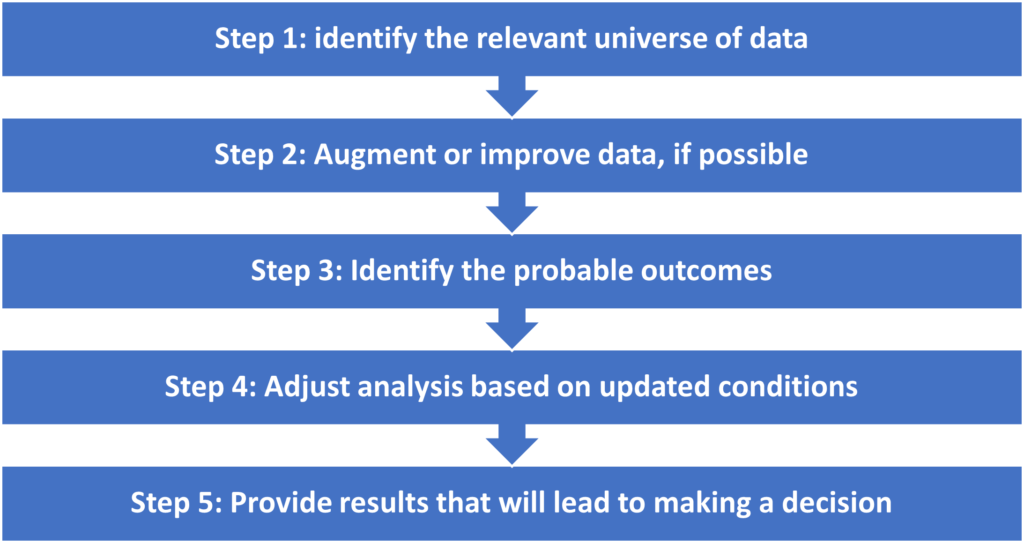
Step 1: identify the relevant universe of data
One way to model an initial guess is to think about the distribution of letters in the English language. Any fan of the popular game show “Wheel of Fortune” has learned to identify R, S, T, L, N, and E as frequently used letters. But how common are those letters?
One analysis of the Oxford English Dictionary done by Lexico.com shows that the relative frequency of letters in the English language is as follows:
| Letter | Frequency | Letter | Frequency |
| A | 8.50% | N | 6.65% |
| B | 2.07% | O | 7.16% |
| C | 4.54% | P | 3.17% |
| D | 3.38% | Q | 0.20% |
| E | 11.16% | R | 7.58% |
| F | 1.81% | S | 5.74% |
| G | 2.47% | T | 6.95% |
| H | 3.00% | U | 3.63% |
| I | 7.54% | V | 1.01% |
| J | 0.20% | W | 1.29% |
| K | 1.10% | X | 0.29% |
| L | 5.49% | Y | 1.78% |
| M | 3.01% | Z | 0.27% |
This is probably a good enough starting point. Or is it?
Step 2: Augment or improve data, if possible
Stanford GraphBase has a repository of 5757 five letter words used as a starting point for analysis. We know this isn’t exactly the Wordle word bank, as the New York Times wrote an article describing how Wardle and his partner Palak Shah whittled down the word bank to a 2,500 word pool. We can use this to come up with a more specific distribution of letters. So, how does that differ?
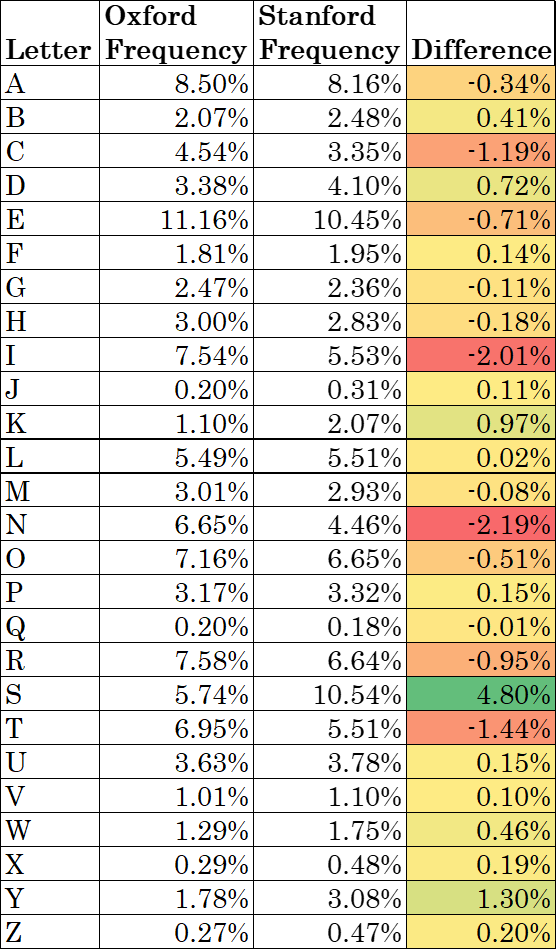
Surprisingly, there’s enough of a difference that we need to decide on which option to use. We know that a lot of plural worlds end in s, for instance, which is reflected in the Stanford data. If I were doing this for work, I would look at all of the s-ending words and determine which of those were plural, then cleanse that data since I assume Wordle does not have duplicate plurals. But since Wordle is not a mission-critical project, I’ll stick with using the Stanford data as it has a number of other useful insights.
Step 3: Identify the probable outcomes
So, what are the chances that a specific letter will show up in each word? Wordle isn’t just about the combination of potential letters that can be translated into words. In a theoretical sense, there are 26^5 potential combinations of words that exist or 11,881,376 words. But in reality, we know that AAAAA and ZZZZZ are not words.
Here’s a quick breakdown of how often each letter shows up in each position in the Stanford five-letter data along with a few highlights of letter positions that stand out as being especially common or especially rare.
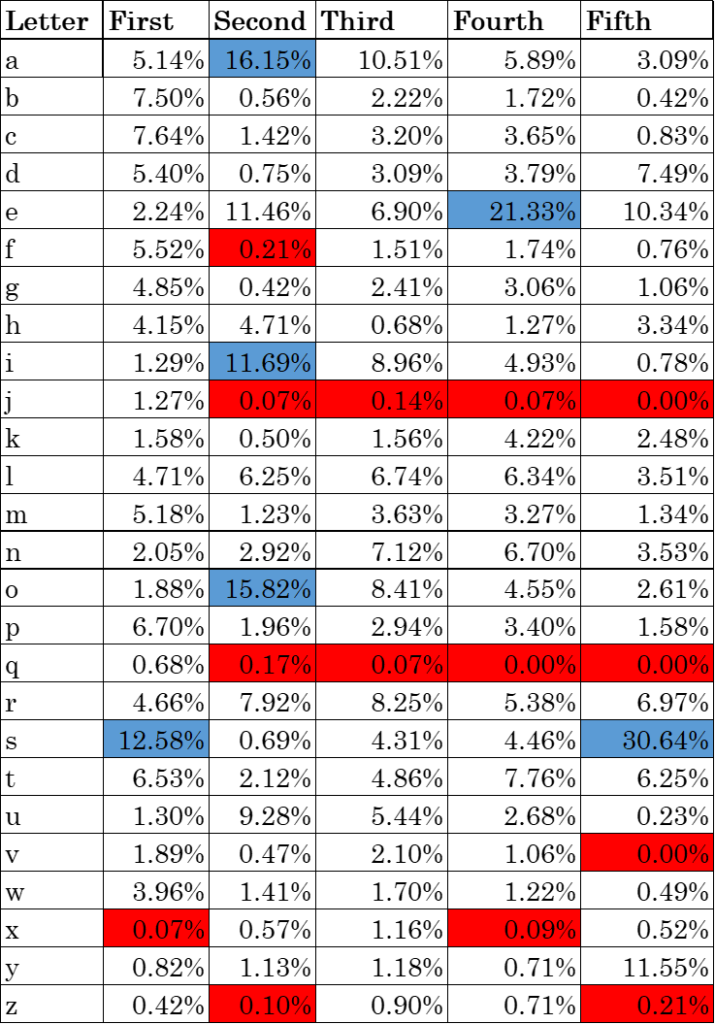
The 30.64% of words ending in “s” are overwhelmingly plural nouns or singular verbs which leads to the big question of whether one believes that “s-ending” words are in Wordle or not. If they are, this chart works well. If not, we can use the Oxford estimate instead, which will give us less granular information.
1 – (1-[probability])^5
But with the Stanford data, we can do one better and look both at the possibility of each letter in each position as well as to get an idea of the overall odds that a letter might be used by looking at
- – [(1 – (First)) * (1 – (Second)) * (1 – (Third)) * (1 – (Forth)) * (1 – (Fifth))]
To figure out the chances that a letter will be used. And we come to the following table and chart.
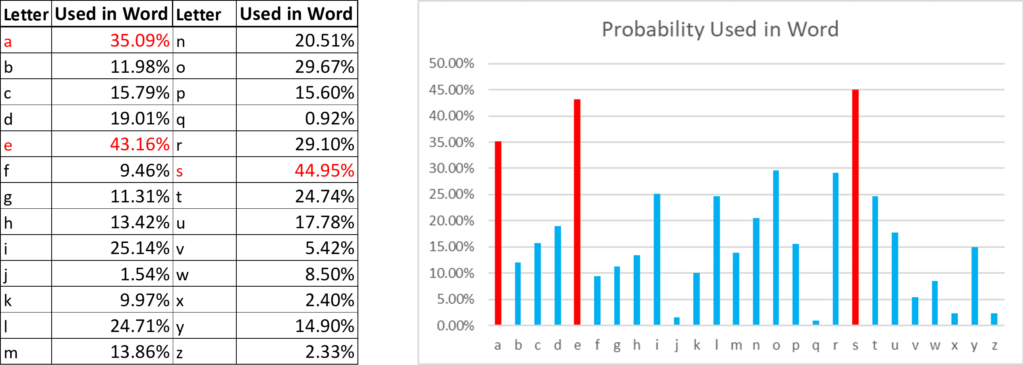
I highlighted the three letters most likely to show up. I didn’t show off the next tier only because I was trying to highlight what stood out most. In general, I try to highlight the top 10% of data that stands out just because I assume that more than that means that nothing really stands out. My big caveat here is that I’m not a visual person and have always loved data tables more than any type of visualization, but I realize that is not common.
Step 4: Adjust analysis based on updated conditions
As we gain a better understanding of our Wordle environment, the game provides clues on which letters are associated with the word in question. Letters that are in the word of the day but are not in the right position are highlighted in yellow. Based on the probabilities we have, we can now adjust our assumptions. For instance, let’s look at the letter “a”

If we are looking at a word that has the letter “a”, but we know it is not in the first position, we know now we’ve cut down the percentage of words we’re thinking of by about 10%. We can also see that if that “a” isn’t in the second position, it’s probably in the third position.
Step 5: Provide results that will lead to making a decision
Based on the numbers, we can now guess that there’s a 50% chance that “a” is in the second position as 16% of five-letter words have an “a” out of the 31.57% of words that have an “a” but not in the first position. That is just one small example of the level of detail that can be made based on the numbers. But if I am providing this information with the goal of helping with guidance, I am probably not going to provide these tables as a starting point. Rather, I would start by providing guidance on what action to take. The starting point would likely be something like:
The letters used more than 20% of the time in five-letter words are the vowels a, e, i, and o and the consonants l, n, r, s, & t, much as one would expect from watching Wheel of Fortune. Top words to start with based on this criteria include “arise,” “laser,” and “rates.”
In contrast, if one wishes to make the game more challenging, one should start with words that are unlikely to provide an initial advantage. Words such as “fuzzy” and “jumpy” are relatively poor starting points from a statistical perspective.
Conclusion
First, this common approach to data definitely showed me a lot about Wordle that I wouldn’t have known otherwise. I hope this approach helps you both in thinking about your own Wordle approach and to further explore the process of Wordle and other data. And it all started with some basic steps:
So, having done all this analysis, how much do analytics help the Wordle experience? One of the things that I find most amazing about the process of playing Wordle is how our brains approximate the calculations made here from a pattern recognition perspective that reflects our use of language. Much as our brain is effectively solving the parallax formula every time we catch a ball thrown in the air, our brains also intuitively make many of these probabilistic estimates based on our vocabulary every time we play a game of Wordle.
I think that analytic approaches like this help to demonstrate the types of “hidden” calculations that often are involved in the “gut reactions” that people make in their decision-making. Gut reactions and analytic reactions have often been portrayed as binary opposites in the business world, but gut reactions can also be the amalgamation of intelligence, knowledge, past experiences, and intuitive feelings all combined to provide a decision that can be superior or more innovative in comparison to pure analytic decisions. Analytics are an important part of all decision-making, but it is important not to discount the human component of judgment in the decision-making process.
And as far as Wordle goes, I think it is fun to try the optimized version of Wordle a few times to see how it contrasts with your standard process. On the flip side, this data also provides guidance on how to make Wordle harder by using words that are less likely to be helpful. But ultimately, Wordle is a way for you to have fun and analytics is best used to help you have more fun and not to just turn Wordle into an engineering exercise. Happy word building and good luck!