Yesterday, IBM filed suit against Micro Focus for claims of copying part of the z/OS for data mapping in the web services implementation of Micro Focus Enterprise Suite. To understand this suit, I think the most relevant excerpts of claims in the suit are:
26. CICS® TS (Customer Information Control System Transaction Server) Web Services uses a “web service binding file,” known as a WSBIND file, to expose CICS® TS programs as web services and maps data received.
40. Micro Focus’s Enterprise Suite offers a web services implementation (“Micro Focus Web Services”) that includes a WSBIND file for mapping data • Micro Focus’s WSBIND file uses IBM internal structures that are not available outside of IBM. • The Micro Focus utility processing reflected in the log file exhibits the same configuration, program sequence, program elements, program optimizations, defects, and missing features as the corresponding CICS® TS utility programs. • Micro Focus’s WSBIND file is encoded in EBCDIC—like IBM’s—yet, Micro Focus has no need for using that encoding as it uses an ASCII environment.
(Analyst’s note: I think this is probably going to be one of the key hinges of the lawsuit. EBCDIC is really an IBM-specific format at this point while ASCII is everywhere. A bit weird to use IBM’s specific encoding for characters.)
42. …no legitimate reason for Micro Focus to have copied IBM’s computer program. Without copying from IBM, Micro Focus had a broad range of design and architectural choices that would have allowed it to create software that offers the same features as the Micro Focus Enterprise Suite.
It’s no secret that IBM has bet the farm on modernization and digital transformation (see Red Hat). The ability to manage IBM customer technology evolution is core to the future of the business. If nothing else, this suit sends a strong message: Don’t Mess with the zSeries. I’m interested to see how this suit will reference Google vs. Oracle: this isn’t the same, but I’d imagine Micro Focus will try to make it sound that way.
At this year’s VMware Explore, VMware announced the launch of VMware Aria based on three product families: VMware vRealize, CloudHealth by VMware, and Tanzu Observability. Aria brings these three solutions together with a shared graph data store, VMware Aria Graph, to support a combined Aria Hub that provides automation, cost, and observability capabilities across multiple clouds.
VMware was already an Amalgam Insights Distinguished Vendor for Cloud Cost Management prior to this announcement as the market leader in Technology Expense Management with over $20 billion in annual spend under management.
Organizations sometimes describe the job of cloud cost management as a “FinOps” role (an abbreviation of “Financial Operations” or “Financial Cloud Operations”) or as a Cloud Economics position. Amalgam Insights finds that there is confusion about these terms. Here’s why.
The common-sense definition of Financial Operations belongs to the Finance team responsible for financial close, budgeting, planning, treasury, tax, and accounting. Meanwhile, the concept of “economics” typically applies to the ecosystem of the production and consumption of value. In many cases, that goes beyond the scope of a standard “cloud economics” role, which focuses on cloud optimization and cost management.
However, in practice, these terms of FinOps and Cloud Economics are often used interchangeably to refer to managing costs, as well as inventory and governance. This is misleading on a variety of levels. The appropriation of “FinOps” to be cloud-specific is confusing enough, especially since a separate “FinOps” is starting to emerge for financial applications used to assist with planning, budgeting, close, consolidation, treasury management, and other financial tasks requiring some strategy, workflow, or collaboration to complete. The Cloud Economics term is a challenge for a different reason: it is an inaccurate term as economics should refer to the financial and business value associated with cloud deployments, including sales bookings and support costs at the microeconomic level and the environmental impact and ecosystem costs at the macroeconomic level. Economics, finance, and accounting are three separate concepts that the IT department needs to understand.
Amalgam Insights acknowledges that this is a common occurrence and hopes this note provides clarity for the reader who may find herself already acting as a “cloud economist” or “FinOps practitioner” based on activity around managing cloud costs while perhaps not being familiar with this terminology. The biggest concern Amalgam Insights has with these inaccurate terms is that the use of these terms may lead to the trivialization of these roles as FinOps or cloud economists are typecast as “cost analysts” rather than personnel who understand the business repercussions of cloud on the business as a whole. Cost analysts are a cost center while business analysts who understand revenue root causes are often a profit center.
In this light, what can FinOps and cloud economics personnel do to avoid being pigeonholed? Here’s Amalgam Insights’ advice.
1) Talk to the finance team in charge of organizing and managing IT costs. Somebody at the finance team has to either articulate the value of IT or rolls IT up into general and administrative costs or cost of goods sold. Understand how IT is categorized in your organization, as cloud may be miscategorized.
2) Understand the full lifecycle of cloud costs. This includes vendor sourcing, contract negotiations, optimization, service rationalization, and the security and governance concerns associated with technology vendor selection. Do not be stuck within one small section of Technology Lifecycle Management within a complex spend category such as cloud unless you are seeking to be commoditized over the next few years.
Finally, understand the economics associated with cloud. ESG (Environmental, Social, and Governance) is an increasingly important and strategic topic for businesses seeking to improve branding and reduce their risk to any operations that may lead to future concerns. If you want to be associated with economics, understand not just the services and technologies supported but their impacts on the environment and to the service provider. This allows you to be a resource not just for IT, but also for the CFO, Chief Strategy Officer, Chief Procurement Officer, and other strategic vendors.
On August 16, 2022, Sync Computing, an Amalgam Insights Distinguished Vendor for Cloud Cost Management, announced a $15.5 million round of equity and debt financing led by Costanoa Ventures with participation from prior investors The Engine, Moore Strategic Ventures, and National Grid Partners. Sync Computing has already differentiated itself in the cloud infrastructure optimization market for its capabilities to automate the provisioning and orchestration of cloud both from a cost and runtime perspective based on a proprietary mathematical approach (an oscillator-based Ising machine for those seeking the primary technical inspiration used in Sync applied to optimizing data pipelines) covered in our Cloud Cost Management SmartList. From a business perspective, this means two things: cost management and improved performance.
Amalgam Insights believes that this funding round will help Sync Computing to further enhance its differentiation in the current cloud cost and infrastructure optimization markets as data and machine learning companies seek a starting point to help them to identify cost and performance opportunities, provide options to improve either the cost-basis or revenue-enhancing aspects of infrastructure, and implement these capabilities. This announcement included the general availability announcement of an Apache Spark Autotuner, which will allow data engineers to broadly optimize data environments. We also believe that this funding will help Sync Computing to accelerate the roadmap items described in our SmartList, including enhanced support for both their Autotuner and Orchestrator products to support Google Cloud Platform and Microsoft Azure as well as Kubernetes cluster management support and support for PyTorch and TensorFlow.
As a side note, Amalgam Insights believes this construction of financing is a smart move as it reduces the amount of equity that Sync Computing’s founders need to give up in order to obtain the cash they are receiving to run the company. If the company grows as expected, the interest rate associated with debt will be less than the cost of equity given up in the long run. Given the nature of Sync Computing’s offering at a time when enterprises are seeking to rationalize and optimize their big data and machine learning environments, this bet seems wise.
The involvement of Costanoa Ventures is significant as it has emerged as a top-tier venture capital firm for supporting data and machine learning infrastructure management with portfolio investments including Alation, Bigeye, and Pepperdata as well as a variety of AI-enabled applications ranging from 6sense to Intacct to Lex Machina, all of which have been acquired.
With this round of funding, Amalgam Insights believes Sync Computing is well-positioned to continue on its currently unique path of supporting the combination of recommenations, automated configuration, cost management, and performance optimization without requiring additional investment in headcount or skills.
On August 2, 2022, Calero-MDSL announced the acquisition of Network Control, a telecom expense and managed mobility services vendor based in Waverly, Iowa. This acquisition continues the acquisitive streak of Calero-MDSL and increases its status as the largest telecom expense management solution in terms of spend under management.
Network Control provides telecom expense management and managed mobility services. Founded in 1998 and headquartered in Waverly, Iowa, Network Control was privately held with no outside investment. Network Control is owned by Mark Hearn, a long-time TEM executive who purchased the company in 2011. Amalgam Insights estimates that Network Control has roughly doubled in headcount to approximately 100 employees between the 2011 acquisition and the 2022 purchase by Calero-MDSL.
With this acquisition, Calero-MDSL is making greater strides into the mid-market in acquiring a client base that collectively includes over 200,000 devices and $300 million in spend under management over 75 customers. From a pure spend perspective, Network Control does not represent a substantive addition to Calero-MDSL’s estimated $22 billion under management as the largest TEM in terms of spend under management. However, Network Control brings several important skills to Calero-MDSL that will be vital for the continued growth of the combined company.
First, Network Control has shown the ability to consistently win new business in the mid-market enterprise and is known for its retention. In Amalgam Insights’ CIO Guide for Wireless Expense Management, Network Control was listed as one of Amalgam Insights’ Distinguished Vendors based on its 98%+ retention rate for customers, with the majority of account losses over time coming from merger and acquisition activity or from the cessation of business activities. Mid-market enterprises between $1 million and $20 million in annual telecom spend is an increasingly competitive space for the large TEM vendors that are reaching the practical limits of saturation among the Global 2000 where they have traditionally focused. As TEM has become an established business practice over the past 15-20 years, TEM vendors have been able to polish both their software platforms and managed services capabilities and now are better positioned to provide these capabilities downmarket to support the next $200 billion in global mid-market telecom and technology spend that has traditionally been almost a greenfield market.
In addition, Network Control brings strong managed services capabilities for managed mobility, with approximately 100 employees trained in supporting a managed mobility services organization across operations, logistics, sales, and other business functions which will be valuable to Calero-MDSL in bolstering existing managed mobility capabilities. Network Control is known for its flexibility and client-centric focus in bringing new services to clients as well as for the quality of customer service provided.
Network Control also has a sustained record of winning deals against the likes of Tangoe and Sakon, which happen to be two of Calero-MDSL’s largest rivals in the TEM space. In our CIO Guide, we saw that Network Control ran into competitive deals in approximately 80% of their sales, which was indicative both of the relatively educated nature of potential customers and Network Control’s ability to win against larger vendors.
What to Expect?
First, for mid-market businesses between $100 million and $5 billion in annual revenue, expect increased attention from TEM companies seeking your business to manage your telecom spend. They are seeking environments that have been manually managed or managed with spreadsheets and fall under the IT Rule of 30, which states that any unmanaged IT spend category averages 30% in duplication and waste. This will also be a shift for TEM and MMS vendors that have traditionally sold into the mid-market and found that their biggest competition was against the status quo. As this market starts to shift towards what is being called the “mid-market” or the “mid-enterprise,” expect to see more competitive deals. Calero-MDSL has acquired a company that has a history of winning mid-market business against Calero-MDSL’s biggest rivals based on understanding mid-market pain points and service needs. By adding marketing and sales muscle to Network Control’s operational capabilities, Calero-MDSL has an opportunity to support the mid-market in an unprecedented way.
Second, this acquisition looks like it could kick off a second wave of TEM consolidation. In the early 2010s, there was a massive wave of consolidation in the TEM market driven by venture capital-backed vendors seeking exits or running out of funding. In the 2020s, the situation is slightly different as the firms that have remained to this day tend to be privately owned and profitable companies that have established both best practices and processes to support loyal customer bases. We have started to see the acquisition of these private firms with the acquisitions of Vision Wireless and Wireless Analytics by Motus and with this acquisition, but there are at least a half dozen additional firms with strong mid-market experience that would be strong candidates for a similar acquisition or rollup. However, the big caveat here is that any acquisition of these companies needs to be coupled with a strong customer service culture as the mid-market TEMs Amalgam Insights covers frequently average 98% retention or higher with over 100% wallet share; this is a demanding market where technology, services, and client management must be aligned.
Third, this acquisition shows that the cost of acquiring talent is still significant in the TEM world. Calero-MDSL would have needed an extra year to find the volume of high-level talent that they are getting at one time with the acquisition of Network Control. The ability to find personnel with experience in managing the spend and procurement of millions of dollars in annual technology spend is still relatively rare. This skill will become increasingly necessary in the recessionary times that we are currently facing. Companies cannot simply eliminate technology, so they will need to financially reconcile their environments both with in-house and third-party resources. Network Control has proven its ability to maintain a high level of service by maintaining a high staff-to-client ratio, a practice that Amalgam Insights recommends keeping as the relative cost of labor is smaller than the cost of finding a new customer.
Fourth, it is safe to assume that Network Control was purchased for its talent, capabilities, and client base rather than its software platform. Although Network Control’s TEMNet is a functional platform, the amount of investment that Calero-MDSL has put into its platform ensures that customers will eventually be migrated to this platform. As long as this migration is handled carefully, this should not be a challenge. Calero-MDSL has prior experience in migrating clients from previous acquisitions A&B Groep and Comview, among others.
Overall, Amalgam Insights believes that this acquisition will be accretive to Calero-MDSL both in providing greater capacity to support managed mobility services and to learn the demands of mid-market clients from an experienced team. This acquisition also will eventually provide Network Control clients with access to the Calero-MDSL platform, which has been built to support global environments and now also includes Unified Communications as a Service and Software as a Services support. Amalgam Insights believes this acquisition demonstrates Calero-MDSL’s continued commitment to expanding its market share and providing telecom and technology expense savings to a wider clientele of organizations.
On June 16, 2022, Vendr, a SaaS (Software-as-a-Service purchasing platform) announced a $150 million Series B round co-led by prior investor Craft Ventures and novel investor SoftBank Vision Fund 2 and joined by Sozo Ventures, F-Prime Capital, Sound Ventures, Tiger Global, and Y Combinator. The company states that this funding will drive platform enhancements.
Why this funding announcement matters
To fully contextualize this announcement, Amalgam Insights will dig into the context of the macroeconomic issues driving the importance of this announcement, the tactical importance of a SaaS purchasing solution in the Technology Lifecycle Management (TLM), and the nature of the investment compared to other historical funding announcements in the TLM space.
Macro Trends for Corporate Spend Reduction
First, this announcement comes at a time when the United States is facing inflation that approaches double-digits. The current 8.6% inflation rate in this country threatens to devour the average 8.19% net margin that publicly traded companies (excluding financial services) currently achieve. In addition, we are facing a global recessionary trend driven by COVID, supply chain issues, geopolitical strife including the occupation of Ukraine, strained Sino-US relations, inconsistent oil and gas policies, and an excess of money supply created over the past several years. In the face of these global challenges, it is prudent for companies to seek to reduce discretionary costs where it is possible and to shift those costs to strategic growth areas. Traditionally, recessions have been a time when strong companies invest in their core so that they can execute when the economy picks up again.
SaaS as a Strategic and Expanding Complex Spend Category
In this context, SaaS is a massive, but complex, opportunity to cut costs. Amalgam Insights estimates that the SaaS market has grown 25% per year in each of the last two years. Multiple studies show that enterprises that have reached the billion-dollar annual revenue threshold average over 300 apps directly purchased by the organization and over 900 apps running over their networks, either on in-office networks or on employee devices. The hundreds of apps here obviously equate to hundreds, possibly thousands, of accounts and bills that can be consolidated, negotiated, and potentially rationalized to concentrate spend on strategic vendors and gain purchasing power. It is not uncommon to find large enterprises using 20 or more different project management solutions, just to look at one SaaS subcategory.
This rationalization is vital if enterprises are to take the IT Rule of 30 seriously. Amalgam Insights states that the IT Rule of 30 is that any unmanaged IT category averages a 30% opportunity to cut costs. But that 30% requires following the Technology Lifecycle to fully uncover opportunities to cut costs.
Technology Lifecycle Management
The majority of companies that Amalgam Insights speaks to in the IT expense role limit their diligence in IT spend to the right side of this lifecycle including timely bill payment, possibly cross-charging to relevant business entities and cost centers, and right-sizing expenses by finding duplicate or over-provisioned accounts. While this is necessary to execute on the IT Rule of 30, it is not sufficient. In the SaaS space, Amalgam Insights believes there is conservatively a $24 billion spend reduction opportunity globally based on improved SaaS purchasing and negotiations. At the micro level, this equates to a 2 million dollars for the average billion-dollar+ enterprise, with results varying widely based on SaaS adoption (as SaaS only makes up 30% of overall enterprise software spend globally), company size, and level of internal software contract knowledge.
Putting The Investment in Perspective
Amalgam Insights understands the scale of this business opportunity. Even so, this $150 million B round represents a massive round in the Technology Lifecycle Management space. Consider other large funding rounds in this space including:
I hasten to add here that more is not always better. But this range of funding rounds is meant to show the amount of investment that typically goes into solutions designed to manage technology expenses, inventory, and sourcing. At first glance, Vendr’s funding round may seem like just another funding announcement in the billions and trillions of dollars involved in the tech sector to those who do not cover this space closely. But as someone who has covered telecom, cloud, and SaaS expense management closely for the last 14 years, this round stands out as a massive investment in this space.
In addition, the investors involved in this round are top-tier including Craft Ventures, where founder and ex-Paypal founder David Sacks has been a proponent of Vendr, and the combination of Tiger Global and Softbank, which may be the two most aggressive funds on the planet in terms of placing big bets on the future. The quality of both smart money and aggressive money in this investment during a quasi-recessionary period speaks to the opportunity that exists here.
What to expect from this round?
The official word from Vendr so far is that this funding round is about data and platform. Vendr acquired SaaS cost and usage monitoring firm Blissfully in February 2022 to bring sourcing and expense management together and support the full lifecycle for SaaS. Amalgam Insights expects that some of these funds will be spent to better integrate Blissfully into Vendr’s operations. In addition, the contract information that Vendr has represents a massive data and analytics opportunity, but this will likely require some investment into non-standard document management, database, machine learning, and data science technologies to integrate documents, tactics, terms, and results. Whether this investment takes the form of a multi-modal database, graph database, sentiment analysis, custom modeling, process mining, process automation, or other technologies is yet to be seen, but the opportunity to gain visibility to the full SaaS lifecycle and optimize agreements continuously is massive not only from a cost perspective, but also a digital transformation perspective. The data, alone, represents an immediate opportunity to either productize the benchmarks or to provide guidance to clients with ongoing opportunities to align SaaS usage and acquisition trends with other key operational, revenue, and employee performance trends.
This part is editorializing, but Vendr has the opportunity to dig deeper into tech-driven process improvement compared to current automation platforms that focus on documenting and driving process, but have to abstract the technologies used to support the process. In the short term, Vendr has enough work to do in creating the first SaaS Lifecycle Management company that brings buying, expense, and operations management together. But with this level of funding, Vendr has the opportunity to go even further in aligning SaaS to business value not only from a cost-basis perspective, but from a top-line revenue contribution perspective. Needless to say, Amalgam Insights looks forward to seeing Vendr deliver on its vision for managing and supporting SaaS management at scale and to tracking the investments Vendr makes in its people, products, and data ecosystem.
On March 28, HP announced an offer of $3.3 billion to acquire integrated communications vendor Poly. Poly, created from the merger of Plantronics and Polycom, acquiring @PolyCompany is interesting because both firms have a long history of supporting remote and home offices. Both companies have dealt with the challenges of the digital office. But this acquisition hints at a potential split for HP.
HP is obviously known as a printer company and printer ink prices ($3,000 per gallon) make even the most expensive gas pumps look like amazing bargains. But HP also has its Z by HP workstation brand, which is well-aligned to the Poly portfolio. It would be great to see that combined Poly/Z portfolio come together as the future of the digital office and to create that new “office in a box” or “office in a browser” that is always a goal for tech companies. There are still a few gaps in the portfolio, though.
The starting point is good spatial audio. As Poly has known since its telepresence days, 2 big secrets to optimal video conferencing are life-sized video and spatial audio. Both are hardware accessory issues: camera & speakers. Poly is great at the former, so-so at the latter. To take this a step further, HP Poly can be the smart accessory (and maybe even the programmable accessory) company providing all of the accessories beyond the phone and PC to support a better office, but this also requires continued API investment. Poly could have been the smart watch & VR headset company, but didn’t keep up. The opportunity is still there if Poly takes the immersive home office seriously and provides the one-stop shop for transforming the kitchen/guest bedroom/garage/remote office room into a communications hub.
And all that video and audio data is an obvious fit with the #datascience @ZbyHP portfolio. So, if all this makes sense, what is the issue?
Printer Ink.
For HP to pursue this path, it must embrace a business model path with one eye towards the actual Metaverse: VR, AR, workflow digitization, & eliminating the need for print. Z/Poly provides an obvious set of next steps: smart accessories, continued growth of the developer community, process automation & workflow orchestration Printers can be a part of this future if they are “iPhoned” to support higher dpi & eliminate the need for constant ink but anybody who has ever tried to implement a printer from scratch knows just how prehistoric this experience is compared to the mobile, SaaS, Big Data world that is pervasive in our consumer lives where even our refrigerators and light bulbs are now able to give us recommendations.
Does HP have the stomach to truly disrupt itself over the next decade, as Netflix wiped out its mail business & destroyed the value of its DVD library? Or will it spin out Z/Poly to maximize value? Or will Poly become a cash cow held back by legacy HP? HP now has more tools to truly reinvent the digital home office when remote employees can dip into the real estate budget. It will be fairly clear within this calendar year which of these three options ends up being HP’s true intentions: wither, cash cow, or innovate.
For the sake of the innovative geniuses who have worked at Plantronics and Poly love the years, I really hope their technology gets a chance to reach the next level. And as an analyst, I look forward to seeing what big brains @blairplez @DaveMichels @zkerravala have to say about this proposed acquisition as I have found their guidance and perspective invaluable over the years as an analyst who has dabbled in their market.
From a Technology Expense Management perspective, the big takeaway here is that the telecom environment is going farther and farther away from the dedicated phone systems and now even mobile devices that have traditionally been the hub of voice and video. HP’s acquisition of Poly will be part of a trend of creating more focused home office solutions as the future of the hybrid workplace requires less investment in 100,000 square foot (10,000 square meter) headquarters spaces and more investment in the 20 square feet (2 square meters) that we choose to work in at any given point. These accessories will require purchasing and tracking just as all business assets require and may have additional connectivity or computational support demands over time just as smartwatches, connected Internet of Things devices, and devices using edge computing require. Connected devices belong in a unified endpoint management solution, but this HP acquisition may start leading to some questions as to whether remote office management is part of a managed print strategy, enterprise mobility strategy, or general IT asset strategy. Amalgam Insights recommends that remote office tech investment, which will eventually match enterprise mobility as a $2,000/employee/year total cost of ownership for all relevant hybrid and home employees, should be handled as part of an enterprise mobility strategy where device management and logistics have already been defined.
Although the subtleties of geopolitical complexity, NATO, the historical Russian Empire, Ukranian governmental changes, European oil and gas supplies, and nuclear arms are far far far beyond the scope of what we cover at Amalgam Insights, we absolutely hope for a quick and peaceful end to this attack.
In the meantime, we live in a global economy and there are specific aspects of this invasion that specifically affects the IT world.
First, plan for potential delays in software development. Ukraine had established itself as an important nearshore and offshore application development source with over 200,000 skilled developers. Many top software companies and enterprises employ developers from Kyiv and other Ukrainian cities. With this invasion, developers are either moving west to Lviv, Ivano-Frankivsk, and Lutsk or into Poland or being conscripted into defense forces. From a practical perspective, this is going to delay development of new versions and features. Check up with your key vendors to see whether there are expected delays based on this issue. Obviously, there is no feature more important than these lives; this is just about being able to manage expectations and to keep in touch with the people who are building the tools you use at work.
Second, check up on cybersecurity. With current sanctions and financial access locked down, Russia will be looking for liquid funds by any ways necessary. This includes ransomware, accessing computing for cryptomining, and using remote computing to mask trails to access other digital assets. This is a good time to update your patches and passwords and to be diligent on social engineering schemes designed to get employees to click through or give away passwords on the phone. Clicking unknown links is always bad, but this is an especially good time to be paranoid about updates even from trusted vendors and suppliers.
Third, keep your cryptocurrency and NFTs (non-fungible tokens) safe. Crypto has been an enabler for black market activity because of its nature as a relatively liquid asset that is relatively easy to transfer. Make sure that any digital assets you or your organization have are backed up on a well-governed store such as ClubNFT. And make sure your crypto is safe on a wallet you own.
Fourth, budget for cloud costs to increase quickly over the rest of the year as the cost of computing increase. Russia and Ukraine are the primary producers and purifiers of the noble gas neon, which is used to etch semiconductors from 180 to 1X nm nodes, which make up roughly 75% of the total market. Ukraine provides 90% of the world’s supply of purified neon, with Iceblick alone estimated to provide over 60% of the world’s neon. As strategic Ukrainian targets are attacked, the supply of neon will decrease in the short term making chip prices go up. Even if Russia manages to create its own purification capacity, sanctions will make neon extremely expensive. As an example, when Ukraine was initially invaded in 2014, neon prices went up 6x.
Fifth, expect a flood of disinformation across all areas. Modern war is conducted not only as a military exercise, but as a financial, digital, informational, and political exercise. There are aspects of information that Putin and the Russian government are interested in controlling for their own specific reasons that can lead to non-factual announcements. This is going to be, in technical terms, “a pain in the ass” to manage as fact checking becomes more important. This may include disinformation around cybersecurity, healthcare, politics, or any other number of areas with the goal of providing distractions. As a key ally of Ukraine and a core member of NATO, the United States will likely be a target of the social rumor mill in a variety of ways. Ironically, I’ll use a Russian proverb for this recommendation: Доверяй, но проверяй (Doveryay, no proveryay – Trust, but verify).
And, obviously, make sure that your organization is not dependent on Russian computing and financial resources as the risk that those resources will be cut off from the rest of the world is unfortunately real as the escalation of cyber and financial conflict increases.
This invasion is a sad and worrisome time for the world. In our roles as technologists and IT shepherds, there is only so much we can do. But it is up to us to make sure that the assets and services that we manage are kept safe and in control in challenging times. Stay safe and keep your organization as safe as possible.
On February 7, 2022, Alteryx completed its acquisition of Trifacta, a data engineering company known for its promotion of “data wrangling” and in bringing to the forefront the challenge of cleansing data in making Big Data useful and supporting machine learning. Alteryx announced its intention to acquire on January 6th for $400 million with an additional $75 million dedicated to an employee retention pool.
Trifacta was founded in 2012 by Stanford Ph.D Sean Kandel, then-Stanford professor Jeffrey Heer, and Berkeley Professor Joe Hellerstein as a data preparation solution at a time when Big Data started to become a common enterprise technology. The company was formed based on Wrangler, a visualization of data transforms that tackled a fundamental problem of reducing the estimated 50-80% of worktime that data analysts and data scientists spent preparing data for analytical use.
Over the past decade, Trifacta raised $224 million with its last round being a $100 million round raised in September 2019. Trifacta quickly established itself as a top solution for data professionals seeking to cleanse data. In a report I wrote in 2015, one of my recommendations was “Consider Trifacta as a general data cleansing and transformation solution. Trifacta is best known for supporting both Hadoop and Big Data environments, including support for JSON, Avro, ORC, and Parquet.” (MarketShare Selects a Data Transformation Platform to Enhance Analyst Productivity, Blue Hill Research, February 2015)
Over the next seven years, Trifacta continued to advance as a data preparation and data engineering solution as it evolved to support major cloud platforms. During this time, three key trends emerged in the data preparation space starting in 2018.
First, data preparation companies focused on the major cloud platforms starting with Amazon Web Services, then Microsoft Azure and Google Cloud. This focus reflected the gravity of net-new analytic and AI data shifting from on-premises resources into the cloud and was a significant portion of Trifacta’s product development efforts over the past few years.
Second, data preparation firms started to be acquired by larger analytic and machine learning providers, such as Altair’s 2018 acquisition of Datawatch and DataRobot’s 2019 acquisition of Paxata. Trifacta was the last remaining market leading data preparation company left on the market for acquisition after having developed the data preparation and wrangling market.
Third, the task of data preparation evolved into a new role of data engineering as enterprises grew to understand that the structure, quality, and relationships of data had to be well defined to get the insights and directional guidance that Big Data had been presumed to hold. As this role became more established, data preparation solutions had to shift towards workflows defined by DataOps and data engineering best practices. It was no longer enough for data cleansing and preparation to be done, but for them to be part of governed process workflows and automation within a larger analytic ecosystem.
All this is to provide guidance on what to expect as Trifacta now joins Alteryx. Although Trifacta and Alteryx are both often grouped as “data preparation” solutions, their roles in data engineering are significantly different enough that I rarely see situations where both solutions are equally suited for a specific use case. Trifacta excels as a visual tool to support data preparation and transformation on the top cloud platforms while Alteryx has long been known for its support of low-code and no-code analytic workflows that help automate complex analytic transformations of data. Alteryx has developed leading products across process automation, the analytic blending in Designer, location-based analytics in Location, as well as machine learning support and Alteryx Server to support analytics at scale.
Although Alteryx provides data cleansing capabilities, its interface does not provide the same level of immediate visual feedback at scale that Trifacta provides, which is why organizations often use both Trifacta and Alteryx. With this acquisition, Trifacta can be used by technical audiences to identify, prepare, and cleanse data and develop highly trusted data sources so that line-of-business data analysts can spend less time finding data and more time providing guidance to the business at large.
Recommendations and Insights for the Data Community
Alteryx clients that consider using Trifacta should be aware that this will likely result in an increased number of analytically accessible data sources. More always sounds better, but this also means that from a practical perspective, your organization may require a short-term reassessment of the data sources, connections, and metrics that are being used for business analysis based on this new data preparation and engineering capability. In addition, this merger can be used as an opportunity to bring data engineering and data analyst communities closer together as they coordinate responsibilities for data cleansing and data source curation. Trifacta provides some additional scalability in this regard that can be leveraged by organizations that optimize their data preparation capabilities.
This acquisition will also accelerate Alteryx’s move to the cloud, as Trifacta provides both an entry point for accessing a variety of cloud data sources and a team of developers, engineers, and product managers with deep knowledge of the major cloud data platforms. Given that Trifacta was purchased for roughly 10% of Alteryx’ market capitalization, the value of moving to the cloud more quickly could potentially justify this acquisition all on its own as an acquihire.
Look at DataOps, analytic workflows, and MLOps as part of a continuum of data usage rather than a set of silos. Trifacta has its 12,000 customers with a mean average of four seats per customer focused on data preparation and engineering. With this acquisition, the Trifacta and Alteryx teams can work together more closely in aligning those four data engineers to the ~30 analytic users that Alteryx averages for each of its 7,000+ customers. The net result is an opportunity to bring DataOps, RPA, analytic workflows, and MLOps together into an integrated environment rather than the current set of silos that often prevent companies from understanding how data changes can affect analytic results.
It has been a pleasure seeing Trifacta become one of the few startups that successfully defines an emerging market of data prep and to coin a term “data wrangling” that was successful enough that it gained market acceptance both with users and with competitors. Many firms try to do this with little success, but Trifacta’s efforts represent the notable exception where its efforts will outlive its time as a standalone company. Trifacta leaves a legacy of establishing the importance of data quality, preparation, and transformation in the enterprise data environment in a world where raw data is imperfect, but necessary to support business guidance. And as Trifacta joins Alteryx, this combined ability to support data from its raw starting point to machine learning models and outputs across a hybrid cloud will continue to be a strong starting point for organizations seeking to provide employees with more control and choice over their analytic inputs and outputs.
If you are currently evaluating Alteryx or Trifacta and need additional guidance, please feel free to contact us at research@amalgaminsights.com to discuss your current selection process and how you are estimating the potential business value of your purchase.
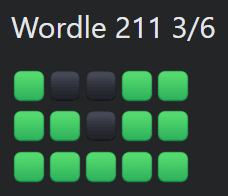
The hottest online game of January 2022 is Wordle, a deceptively addictive online game where one tries to guess a five-letter word starting from scratch. Perhaps you’ve started seeing a lot of posts that look like this:
OK, that said, the rules of this game are fairly simple: you have six chances to guess the word of the day. This game, created by software developer Josh Wardle, was adorably created as a game for his partner to enjoy. But its simplicity has made it a welcome online escape in the New Year. The website isn’t trying to sell you anything. It isn’t designed to “go viral.” All it does is ask you to guess a word.
But for those who have played the game, the question quickly comes up on how to play this game better. Are there quantitative tricks that can be used to make our Wordle attempts more efficient? How do we avoid that stressful sixth try where the attempt is “do or die?”
For the purposes of this blog, we will not be going directly into any direct Wordle sources because what fun would that be?
Here’s a few tips for Wordle based on some basic analytic data problem solving strategies.
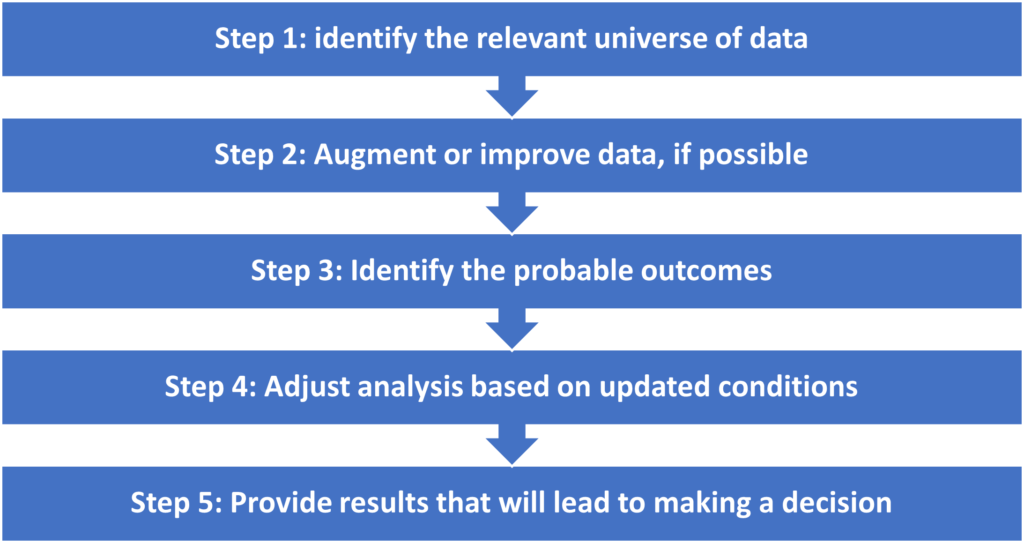
Step 1: identify the relevant universe of data
One way to model an initial guess is to think about the distribution of letters in the English language. Any fan of the popular game show “Wheel of Fortune” has learned to identify R, S, T, L, N, and E as frequently used letters. But how common are those letters?
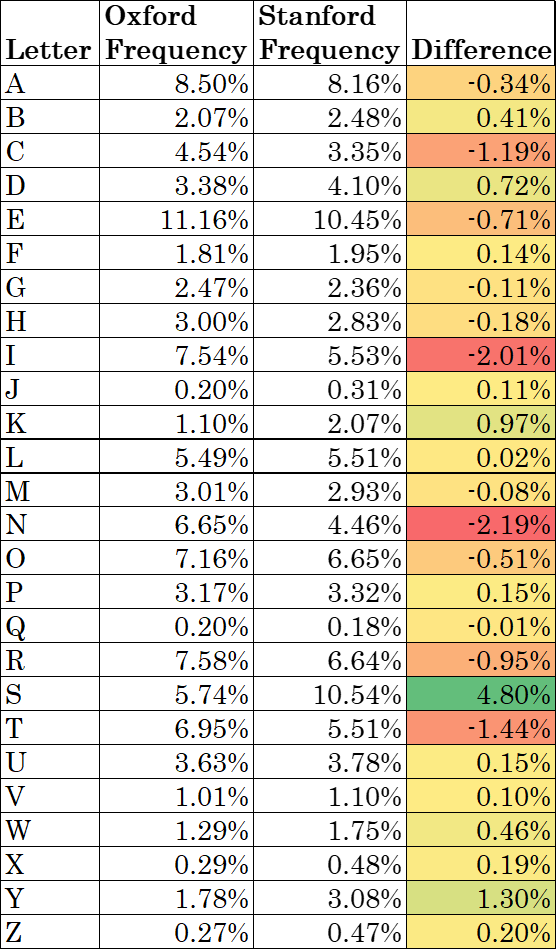
One analysis of the Oxford English Dictionary done by Lexico.com shows that the relative frequency of letters in the English language is as follows:
Letter
Frequency
Letter
Frequency
A
8.50%
N
6.65%
B
2.07%
O
7.16%
C
4.54%
P
3.17%
D
3.38%
Q
0.20%
E
11.16%
R
7.58%
F
1.81%
S
5.74%
G
2.47%
T
6.95%
H
3.00%
U
3.63%
I
7.54%
V
1.01%
J
0.20%
W
1.29%
K
1.10%
X
0.29%
L
5.49%
Y
1.78%
M
3.01%
Z
0.27%
This is probably a good enough starting point. Or is it?
Step 2: Augment or improve data, if possible
Stanford GraphBase has a repository of 5757 five letter words used as a starting point for analysis. We know this isn’t exactly the Wordle word bank, as the New York Times wrote an article describing how Wardle and his partner Palak Shah whittled down the word bank to a 2,500 word pool. We can use this to come up with a more specific distribution of letters. So, how does that differ?
Surprisingly, there’s enough of a difference that we need to decide on which option to use. We know that a lot of plural worlds end in s, for instance, which is reflected in the Stanford data. If I were doing this for work, I would look at all of the s-ending words and determine which of those were plural, then cleanse that data since I assume Wordle does not have duplicate plurals. But since Wordle is not a mission-critical project, I’ll stick with using the Stanford data as it has a number of other useful insights.
Step 3: Identify the probable outcomes
So, what are the chances that a specific letter will show up in each word? Wordle isn’t just about the combination of potential letters that can be translated into words. In a theoretical sense, there are 26^5 potential combinations of words that exist or 11,881,376 words. But in reality, we know that AAAAA and ZZZZZ are not words.
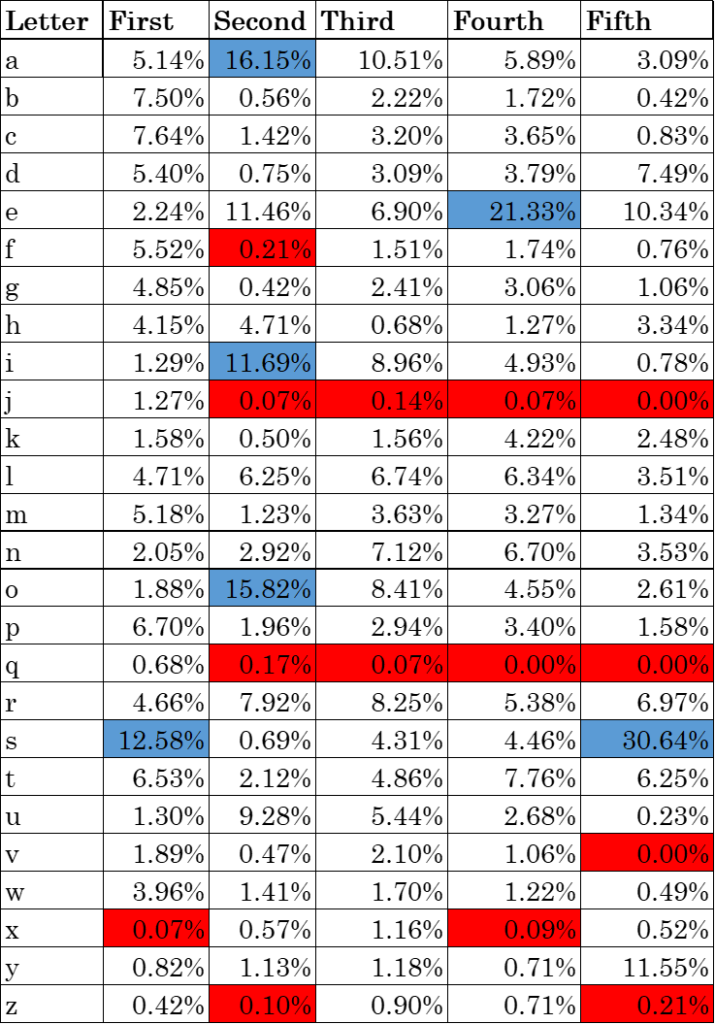
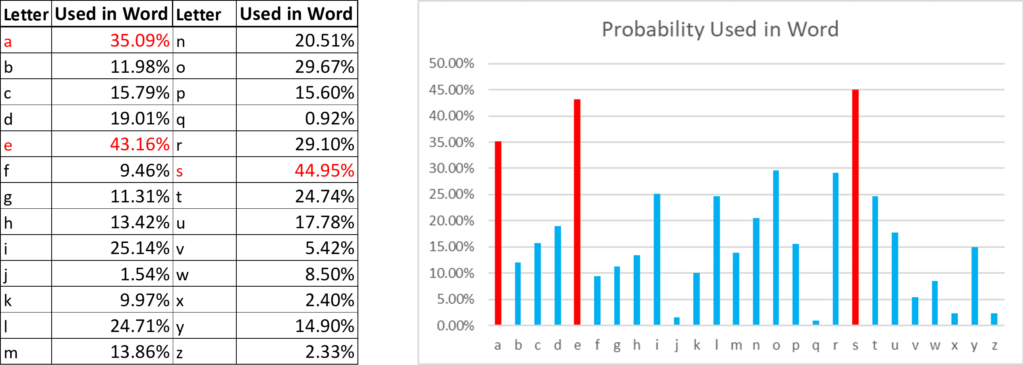
Here’s a quick breakdown of how often each letter shows up in each position in the Stanford five-letter data along with a few highlights of letter positions that stand out as being especially common or especially rare.
The 30.64% of words ending in “s” are overwhelmingly plural nouns or singular verbs which leads to the big question of whether one believes that “s-ending” words are in Wordle or not. If they are, this chart works well. If not, we can use the Oxford estimate instead, which will give us less granular information.
1 – (1-[probability])^5
But with the Stanford data, we can do one better and look both at the possibility of each letter in each position as well as to get an idea of the overall odds that a letter might be used by looking at
To figure out the chances that a letter will be used. And we come to the following table and chart.
I highlighted the three letters most likely to show up. I didn’t show off the next tier only because I was trying to highlight what stood out most. In general, I try to highlight the top 10% of data that stands out just because I assume that more than that means that nothing really stands out. My big caveat here is that I’m not a visual person and have always loved data tables more than any type of visualization, but I realize that is not common.
Step 4: Adjust analysis based on updated conditions
As we gain a better understanding of our Wordle environment, the game provides clues on which letters are associated with the word in question. Letters that are in the word of the day but are not in the right position are highlighted in yellow. Based on the probabilities we have, we can now adjust our assumptions. For instance, let’s look at the letter “a”
If we are looking at a word that has the letter “a”, but we know it is not in the first position, we know now we’ve cut down the percentage of words we’re thinking of by about 10%. We can also see that if that “a” isn’t in the second position, it’s probably in the third position.
Step 5: Provide results that will lead to making a decision
Based on the numbers, we can now guess that there’s a 50% chance that “a” is in the second position as 16% of five-letter words have an “a” out of the 31.57% of words that have an “a” but not in the first position. That is just one small example of the level of detail that can be made based on the numbers. But if I am providing this information with the goal of helping with guidance, I am probably not going to provide these tables as a starting point. Rather, I would start by providing guidance on what action to take. The starting point would likely be something like:
The letters used more than 20% of the time in five-letter words are the vowels a, e, i, and o and the consonants l, n, r, s, & t, much as one would expect from watching Wheel of Fortune. Top words to start with based on this criteria include “arise,” “laser,” and “rates.”
In contrast, if one wishes to make the game more challenging, one should start with words that are unlikely to provide an initial advantage. Words such as “fuzzy” and “jumpy” are relatively poor starting points from a statistical perspective.
Conclusion
First, this common approach to data definitely showed me a lot about Wordle that I wouldn’t have known otherwise. I hope this approach helps you both in thinking about your own Wordle approach and to further explore the process of Wordle and other data. And it all started with some basic steps:
So, having done all this analysis, how much do analytics help the Wordle experience? One of the things that I find most amazing about the process of playing Wordle is how our brains approximate the calculations made here from a pattern recognition perspective that reflects our use of language. Much as our brain is effectively solving the parallax formula every time we catch a ball thrown in the air, our brains also intuitively make many of these probabilistic estimates based on our vocabulary every time we play a game of Wordle.
I think that analytic approaches like this help to demonstrate the types of “hidden” calculations that often are involved in the “gut reactions” that people make in their decision-making. Gut reactions and analytic reactions have often been portrayed as binary opposites in the business world, but gut reactions can also be the amalgamation of intelligence, knowledge, past experiences, and intuitive feelings all combined to provide a decision that can be superior or more innovative in comparison to pure analytic decisions. Analytics are an important part of all decision-making, but it is important not to discount the human component of judgment in the decision-making process.
And as far as Wordle goes, I think it is fun to try the optimized version of Wordle a few times to see how it contrasts with your standard process. On the flip side, this data also provides guidance on how to make Wordle harder by using words that are less likely to be helpful. But ultimately, Wordle is a way for you to have fun and analytics is best used to help you have more fun and not to just turn Wordle into an engineering exercise. Happy word building and good luck!