On January 25, Dremio announced that it had raised $160M in a Series E funding round. This new round comes only a year after a $135M Series D round from last January 2021. Adams Street Partners led the funding round, joined by fellow new investors DTCP and StepStone Group. Existing investor participation came from Cisco Investments, Insight Partners, Lightspeed Venture Partners, Norwest Venture Partners, and Sapphire Ventures. The funding will go towards R+D, customer service, customer education and community-building, and contributions to open source initiatives. Amalgam Insights’ Hyoun Park was quoted in TechTarget on the Dremio investment: Dremio raises $160M for cloud data lake platform technology.
On January 26, Firebolt, a cloud data warehouse, announced a $100M Series C round. Aikeon Capital led the round, with participation from new investors Glynn Capital and Sozo Ventures, and existing investors Angular Ventures, Bessemer Venture Partners, Dawn Capital, K5 Global, TLV Partners, and Zeev Ventures. The funds will primarily go towards expanding the product and engineering teams. Firebolt also announced that Mosha Pasumansky would assume the CTO position, coming over from Google BigQuery, and that Firebolt would be opening a Seattle office.
On January 26, anch.AI launched its ethical AI governance platform, and secured $2.1M in seed funding. Benhamou Global Ventures led the round, with participation from Terrain Invest, Frederik Andersson, Kent Janer, and Magnus Rausing. The funding will go towards further development of the platform.
On January 26, Domino Data Lab debuted Domino 5.0., a major new release of their MLOps platform. Key new capabilities include autoscaling clusters to give data science teams easier access to compute infra; data collectors that will allow teams to securely share and reuse common data access patterns; and integrated monitoring of models in production, with automated insights that compare production data to training data to assess and diagnose model drift. The latest version is available immediately to existing Domino customers, with a trial version available for new customers.
On January 27, Dataiku announced that they were now ISO 27001 certified, citing it as a “business imperative” to protect sensitive customer data from improper access and security breaches. ISO 27001 certification is a consideration for enterprises needing to not only prevent security breaches, but also ensure data is appropriately domiciled to comply with regulations like GDPR and CCPA.
DataRobot continues its AI education efforts with this week’s launch of MoreIntelligent.ai, an expansion of their More Intelligent Tomorrow podcast. Content will include research and analysis, prescriptive takeaways to inform AI practitioner action, and interviews with prominent AI leaders. The prominence DataRobot is giving More Intelligent works suggests that education about AI continues to be key to growing the AI market.
On January 24, Meta unveiled the AI Research SuperCluster, aiming to be the fastest supercomputer in the world when it’s completed in mid-2022. Meta plans to use the RSC to build stronger AI models which will analyze text, images, and video together in hundreds of languages, as a step on the path towards the metaverse.
On January 24, Informatica appointed Jim Kruger as the Chief Marketing Officer. Kruger was previously the CMO at Veeam Software, Intermedia, and Polycom, bringing years of experience in the CMO role as an experienced marketer who understands how to communicate around complex technologies.
Prophecy, a low-code data engineering platform, raised $25M in Series A funding this week. The round was led by Insight Partners, with other participants from existing investors Berkeley SkyDeck and SignalFire, and new investor Dig Ventures. The funding will go towards building out the platform, as well as investing in the go-to-market side. Prophecy seeks to standardize data refinement for use at scale, making the process more predictable and visible.
On January 18, Vectice, a data science knowledge capture company, announced it had raised a $12.6M series A round. The round was co-led by Crosslink Capital and Sorenson Ventures. Additional participants included Global Founders Capital (GFC), Silicon Valley Bank, and Spider Capital. Vectice will use the funds to further expand its team, and to onboard select accounts into their Beta program. Vectice automatically captures the assets that data science teams generate throughout a project, and generates documentation throughout the project lifecycle.
Also this week, Diversio, a diversity, equality, and inclusion platform, raised $6.5M in series A funding. Participants included Chandaria Family Holdings, First Round Capital, and Golden Ventures. Plans for the funding include expanding the sales and client success teams, accelerating product development, and amplifying marketing efforts. Diversio combines analytics, AI, and subject matter expertise to understand where DEI efforts at organizations are getting derailed, and offer action plans for setting and meeting DEI goals.
On January 18, DataRobot released its State of AI Bias Report, assessing how AI bias can impact organizations, along with ways to mitigate said bias. Common challenges organizations face include the inability to understand the reasons for a specific AI decision, or the correlation between inputs and outputs, along with the difficulty of developing trustworthy algorithms and determining what data is used to train a given model. All of these challenges have led to some combination of lost revenue, customers, and employees, along with legal fees and reputation damage to the company; organizations are seeking guidance to avoid these issues.
On Wednesday, January 26, Domino Data Lab will host a free one-hour virtual event: “Unleashing Exceptional Performance,” focusing on data science. Featured speakers include surgeon and author Dr. Atul Gawande, and Janssen Research and Development’s Chief Data Science Officer and Global Head of Strategy and Operations Dr. Najat Khan. There will be two sessions to accommodate various timezones, one at 1300 GMT and one at 11 am PT/2 pm ET. To register for the event, please visit the Domino event registration site.
Today Amalgam Insights publishes its latest Vendor Smartlist to support the Chief Information Officer, Global Wireless Expense Management Leaders for 2022. This report addresses the pain points organizations experience in trying to effectively manage the cost of employee smartphones, tablets, and laptops, as well as corporate Internet of Things sensors across multiple countries and regions. To check out the report, fill out the form below to get this report sent to your email address, then read on to find out what to expect.
The need for device oversight has grown even more critical throughout the COVID-19 pandemic as organizations must re-align spending in line with budgets in the face of a 30% increase in device spend in 2021. When it comes to wireless expense management (WEM), Amalgam Insights notes the IT Rule of 30, which states that any unmanaged IT spend category will average 30% bloat and enterprise mobility is no exception. Enterprises turning to an appropriate vendor can potentially reduce overspending and free internal employees, but these results are dependent on choosing vendors that have relevant experience.
Knowing which WEM provider to choose poses a conundrum for organizations. Amalgam Insights aims to solve this problem with Global Wireless Expense Management Leaders for 2022 by delivering independent insights and recommendations, along with in-depth vendor profiles of the eight largest standalone vendors managing wireless expenses based on spend under management and geographic footprint. Importantly, Amalgam Insights does not rank vendors. Instead, analysts focus on the differentiators among providers such as global coverage, ancillary spend coverage, governance and compliance, integrations, payment processing, automation strategy, and device lifecycle management.
“The Amalgam Insight Vendor SmartList focuses on specifying how vendors differentiate themselves in crowded markets where vendors can sound very similar,” says Amalgam Insights CEO and Principal Analyst Hyoun Park. “By focusing on unique or rare capabilities, CIOs can use the Vendor SmartList to make better decisions compared to raw rankings, reviews, or 2×2 matrices.”
Kelly Teal, Senior Research Analyst at Amalgam Insights, agrees.
“As the cost of doing business fluctuates due to global inflation, global organizations must assess the need to optimize wireless devices, services, applications, and support spend. Understanding the ways different global WEM vendors work with enterprises will help end-users identify the best approach for them and optimize spending.”
This report features Asignet, Calero-MDSL, Cass Information Systems (NASDAQ: CASS), Mindglobal, One Source Communications, Sakon, Tangoe, and Upland Software (NASDAQ: UPLD). Organizations may access the Global Wireless Expense Management Leaders for 2022 using the form below.
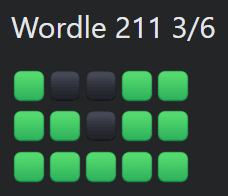
The hottest online game of January 2022 is Wordle, a deceptively addictive online game where one tries to guess a five-letter word starting from scratch. Perhaps you’ve started seeing a lot of posts that look like this:
OK, that said, the rules of this game are fairly simple: you have six chances to guess the word of the day. This game, created by software developer Josh Wardle, was adorably created as a game for his partner to enjoy. But its simplicity has made it a welcome online escape in the New Year. The website isn’t trying to sell you anything. It isn’t designed to “go viral.” All it does is ask you to guess a word.
But for those who have played the game, the question quickly comes up on how to play this game better. Are there quantitative tricks that can be used to make our Wordle attempts more efficient? How do we avoid that stressful sixth try where the attempt is “do or die?”
For the purposes of this blog, we will not be going directly into any direct Wordle sources because what fun would that be?
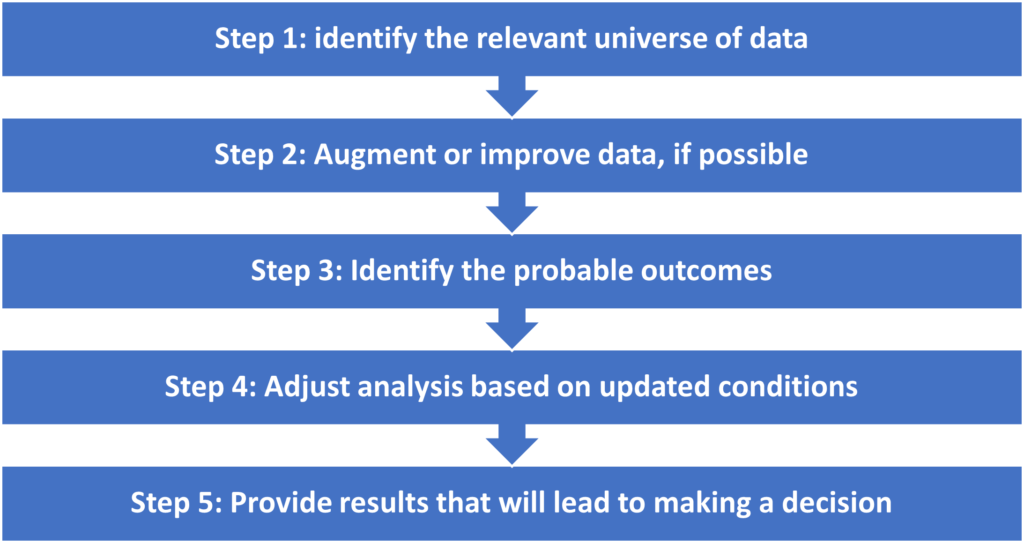
Here’s a few tips for Wordle based on some basic analytic data problem solving strategies.
Step 1: identify the relevant universe of data
One way to model an initial guess is to think about the distribution of letters in the English language. Any fan of the popular game show “Wheel of Fortune” has learned to identify R, S, T, L, N, and E as frequently used letters. But how common are those letters?
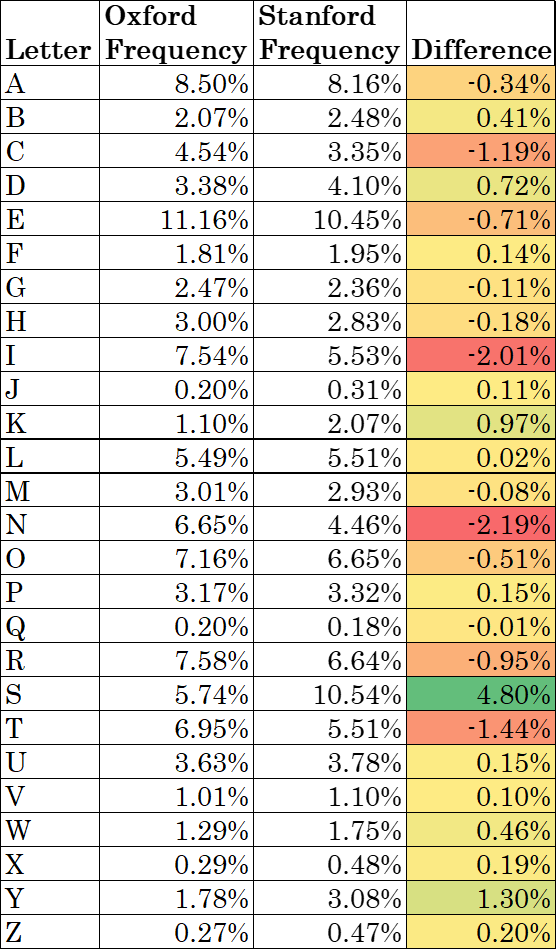
One analysis of the Oxford English Dictionary done by Lexico.com shows that the relative frequency of letters in the English language is as follows:
Letter
Frequency
Letter
Frequency
A
8.50%
N
6.65%
B
2.07%
O
7.16%
C
4.54%
P
3.17%
D
3.38%
Q
0.20%
E
11.16%
R
7.58%
F
1.81%
S
5.74%
G
2.47%
T
6.95%
H
3.00%
U
3.63%
I
7.54%
V
1.01%
J
0.20%
W
1.29%
K
1.10%
X
0.29%
L
5.49%
Y
1.78%
M
3.01%
Z
0.27%
This is probably a good enough starting point. Or is it?
Step 2: Augment or improve data, if possible
Stanford GraphBase has a repository of 5757 five letter words used as a starting point for analysis. We know this isn’t exactly the Wordle word bank, as the New York Times wrote an article describing how Wardle and his partner Palak Shah whittled down the word bank to a 2,500 word pool. We can use this to come up with a more specific distribution of letters. So, how does that differ?
Surprisingly, there’s enough of a difference that we need to decide on which option to use. We know that a lot of plural worlds end in s, for instance, which is reflected in the Stanford data. If I were doing this for work, I would look at all of the s-ending words and determine which of those were plural, then cleanse that data since I assume Wordle does not have duplicate plurals. But since Wordle is not a mission-critical project, I’ll stick with using the Stanford data as it has a number of other useful insights.
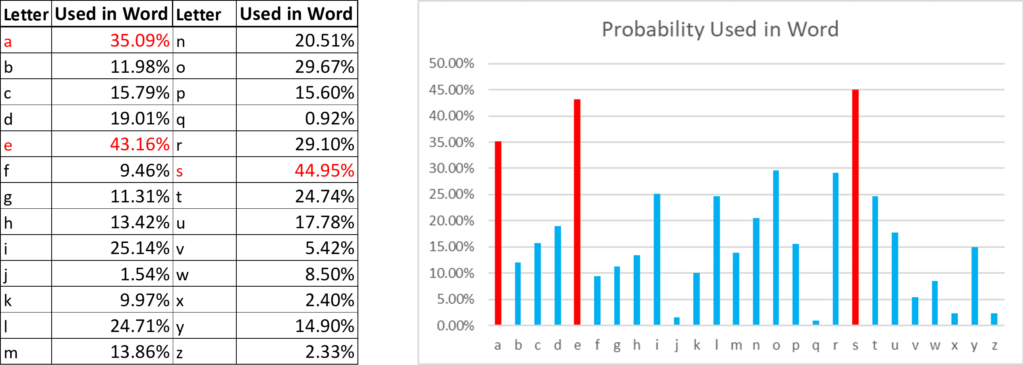
Step 3: Identify the probable outcomes
So, what are the chances that a specific letter will show up in each word? Wordle isn’t just about the combination of potential letters that can be translated into words. In a theoretical sense, there are 26^5 potential combinations of words that exist or 11,881,376 words. But in reality, we know that AAAAA and ZZZZZ are not words.
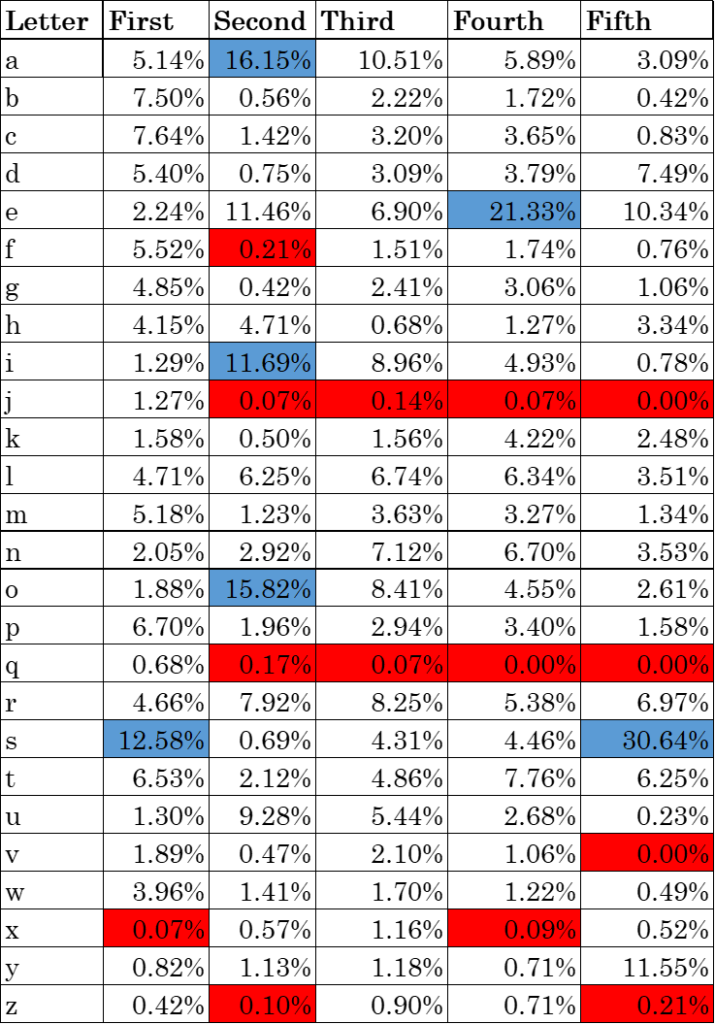
Here’s a quick breakdown of how often each letter shows up in each position in the Stanford five-letter data along with a few highlights of letter positions that stand out as being especially common or especially rare.
The 30.64% of words ending in “s” are overwhelmingly plural nouns or singular verbs which leads to the big question of whether one believes that “s-ending” words are in Wordle or not. If they are, this chart works well. If not, we can use the Oxford estimate instead, which will give us less granular information.
1 – (1-[probability])^5
But with the Stanford data, we can do one better and look both at the possibility of each letter in each position as well as to get an idea of the overall odds that a letter might be used by looking at
To figure out the chances that a letter will be used. And we come to the following table and chart.
I highlighted the three letters most likely to show up. I didn’t show off the next tier only because I was trying to highlight what stood out most. In general, I try to highlight the top 10% of data that stands out just because I assume that more than that means that nothing really stands out. My big caveat here is that I’m not a visual person and have always loved data tables more than any type of visualization, but I realize that is not common.
Step 4: Adjust analysis based on updated conditions
As we gain a better understanding of our Wordle environment, the game provides clues on which letters are associated with the word in question. Letters that are in the word of the day but are not in the right position are highlighted in yellow. Based on the probabilities we have, we can now adjust our assumptions. For instance, let’s look at the letter “a”
If we are looking at a word that has the letter “a”, but we know it is not in the first position, we know now we’ve cut down the percentage of words we’re thinking of by about 10%. We can also see that if that “a” isn’t in the second position, it’s probably in the third position.
Step 5: Provide results that will lead to making a decision
Based on the numbers, we can now guess that there’s a 50% chance that “a” is in the second position as 16% of five-letter words have an “a” out of the 31.57% of words that have an “a” but not in the first position. That is just one small example of the level of detail that can be made based on the numbers. But if I am providing this information with the goal of helping with guidance, I am probably not going to provide these tables as a starting point. Rather, I would start by providing guidance on what action to take. The starting point would likely be something like:
The letters used more than 20% of the time in five-letter words are the vowels a, e, i, and o and the consonants l, n, r, s, & t, much as one would expect from watching Wheel of Fortune. Top words to start with based on this criteria include “arise,” “laser,” and “rates.”
In contrast, if one wishes to make the game more challenging, one should start with words that are unlikely to provide an initial advantage. Words such as “fuzzy” and “jumpy” are relatively poor starting points from a statistical perspective.
Conclusion
First, this common approach to data definitely showed me a lot about Wordle that I wouldn’t have known otherwise. I hope this approach helps you both in thinking about your own Wordle approach and to further explore the process of Wordle and other data. And it all started with some basic steps:
So, having done all this analysis, how much do analytics help the Wordle experience? One of the things that I find most amazing about the process of playing Wordle is how our brains approximate the calculations made here from a pattern recognition perspective that reflects our use of language. Much as our brain is effectively solving the parallax formula every time we catch a ball thrown in the air, our brains also intuitively make many of these probabilistic estimates based on our vocabulary every time we play a game of Wordle.
I think that analytic approaches like this help to demonstrate the types of “hidden” calculations that often are involved in the “gut reactions” that people make in their decision-making. Gut reactions and analytic reactions have often been portrayed as binary opposites in the business world, but gut reactions can also be the amalgamation of intelligence, knowledge, past experiences, and intuitive feelings all combined to provide a decision that can be superior or more innovative in comparison to pure analytic decisions. Analytics are an important part of all decision-making, but it is important not to discount the human component of judgment in the decision-making process.
And as far as Wordle goes, I think it is fun to try the optimized version of Wordle a few times to see how it contrasts with your standard process. On the flip side, this data also provides guidance on how to make Wordle harder by using words that are less likely to be helpful. But ultimately, Wordle is a way for you to have fun and analytics is best used to help you have more fun and not to just turn Wordle into an engineering exercise. Happy word building and good luck!
On January 13, 2022, Observable raised a $35.6 million Series round led by Menlo Ventures with participation from existing investors Sequoia Capital and Acrew Capital. This round increases the total amount raised by Observable to $46.1 million. Observable is interesting to the enterprise analytics community because it provides a platform to help data users to collaborate throughout the data workflow of data discovery, analysis, and visualization.
Traditionally, data discovery, contextualization, analytics, and visualization can potentially be supported by different solutions within an organization. This complexity is multiplied by the variety of data sources and platforms that have to be supported and the number of people who need to be involved at each stage which leads to an unwieldy number of handoffs, the potential issue of using the wrong tool for the wrong job, and an extended development process that results from the inability for multiple people to simultaneously work on creating a better version of the truth. Observable provides a single solution to help data users to connect, analyze, and display data along with a library of data visualizations that help provide guidance on potentially new ways to present data.
From a business perspective, one of the biggest challenges of business intelligence and analytics has traditionally been the inability to engage relevant stakeholders to share and contextualize data for business decisions. The 2020s are going to be a decade of consolidation for analytics where enterprises have to make thousands of data sources available and contextualized. Businesses have to bridge the gaps between business intelligence and artificial intelligence, which are mainly associated with the human aspects of data: departmental and vertical context, categorization, decision intelligence, and merging business logic with analytic workflows.
This is where the opportunity lies for Observable in allowing the smartest people across all aspects of the business to translate, annotate, and augment a breadth of data sources into directional and contextualized decisions while using the head start of visualizations and analytic processes that have been shared by a community of over five million users. And then by allowing users to share these insights across all relevant applications and websites, these insights can drive decisions in all relevant places by bringing insights to the users.
Observable goes to market with a freemium model that allows companies to try out Observable for free and then to add editors at tiers of $12/user/month and $40/user/month (pricing as of January 13, 2022). This level of pricing makes Observable relatively easy to try out.
Amalgam Insights currently recommends Observable for enterprises and organizations with three or more data analysts, data scientists, and developers who are collaboratively working on complex data workflows that lead to production-grade visualization. Although it can be more generally used for building analytic workflows collaboratively, Observable provides one of the most seamless and connected collaborative experiences for creating and managing complex visualizations that Amalgam Insights has seen.
IT Cost Management is one of the core practices at Amalgam Insights. This practice focuses on tracking both vendors and product offerings that help enterprises fight off the IT Rule of 30, Amalgam Insights’ observation that every unmanaged IT category averages 30% in bloat and waste and that this can be even greater for emerging technology areas such as cloud computing.
From our perspective, the demand for a more holistic technology expense capability has been in demand at the enterprise level since the mid-2010s and companies narrowly focused on managing telecom, mobility, software, and cloud computing as four separate IT silos will miss out on a variety of opportunities to optimize and rationalize costs.
In this practice, we tactically look at technology expense management vendors, including specialists in telecom expense, managed mobility services, cloud cost management, cloud FinOps (Financial Operations), Software as a Service management, IT finance solutions, hybrid cloud subscriptions and financing, and other new IT strategies that can lead to a minimum of 20-30% cost reduction in one or more key IT areas. In each of these IT areas, Amalgam Insights maintains a list of recommended vendors that have proven their ability to deliver on both identifying and fixing the issues associated with the IT Rule of 30, which are provided both in our published research as well as in our end-user inquiries with enterprise clients.
With that out of the way, 2021 was a heck of a year from an IT management perspective. Although a lot of pundits predicted that IT spend would go down in a year where COVID-driven uncertainty was rampant, these cost control concerns ended up being less relevant than the need to continue getting work done and the resilience of a global workforce ready and willing to get things done. In doing so, 2021 saw the true birth of the hybrid worker, one who is just as comfortable working in the office or at home as long as they have the right tools in hand. In the face of this work environment, we saw the following things happen.
The Rise of the Remote Employee – Amalgam Insights estimates that 30% of employees will never be full-time in-office employees again, as they have either moved home full-time or plan to only come into the office one or two times per week as necessary to attend meetings and meet with new colleagues and partners. Although many of us may take this for granted, one of the issues we still face is that in 2019, only 5% of employees worked remotely and many of our offices, technology investments, and management strategies reflect the assumption that employees will be centrally located. And, of course, COVID-19 has proven to be both a highly mutating virus and a disease fraught with controversies regarding treatment and prevention strategies and policies, which only adds to the uncertainty and volatility of in-office work environments.
Legacy networking and computing approaches fall flat – On-premise solutions showed their age as VPNs and the on-site management of servers became passe. At a time when a pandemic was running rampant, people found that VPNs did not provide the protection that was assumed as ransomware attacks more than doubled in the United States and more than tripled in the United Kingdom from 2020 to 2021. It turns out that the lack of server updates and insecure ports on-premises ended up being more dangerous for companies to consider. We also saw the Death of Copper, as copper wired telecom services were finally cut off by multiple telecom vendors, leaving branch offices and the “Things” associated with operational technology rudely left to quickly move to fiber or wireless connections. Blackberry finally decided to discontinue to support of Blackberry OS as well, forcing the last of the original Blackberry users to finally migrate off of that sweet, sweet keyboard and join the touch screen auto-correct world of smartphone typers. It was a tough year for legacy tech.
Core Mobility Grew Rapidly in 2021 – Core spend was up 8% due to device purchases and increased data use. In particular, device revenue was up nearly 30% over last year with some of the major carriers, such as AT&T, Verizon, and T-Mobile (now the largest carrier in the United States). However, spend for customized and innovative projects disappeared both as 5G buildouts happened more slowly than initially expected and 5G projects froze due to the inability to fulfill complex mesh computing and bandwidth backfill projects. This led to an interesting top-level result of overall enterprise mobility spend being fairly steady although the shape of the spend was quite different from the year before.
Cloud Failures Demonstrated need for Hybrid and Multi-Cloud Management – Although legacy computing had its issues, cloud computing had its black eyes as well. 8760 hours per year means that each hour down gets you from 100% to 99.99% (4 9’s). Recent Amazon failures in November and December of 2021 demonstrated the challenges of depending on overstressed resources, especially US-1-East. This is not meant to put all the blame on Amazon, as Microsoft Azure is known for its challenges in maintaining service uptime as well and Google Cloud still has a reputation for deprecating services. No one cloud vendor has been dependable at the “5 9’s” level of uptime (5 minutes per year of downtime) that used to define high-end IT quality. Cloud has changed the fundamental nature of IT from “rock-solid technology” to a new mode of experimental “good enough IT” where the quality and value of new technology can excuse some small uptime failures. But cloud failures by giants including Akamai, Amazon, AT&T, Comcast, Fastly, and every other cloud leader show the importance of having failover and continuity capabilities that are at least multi-region in nature for mission-critical technologies.
Multi-cloud Emergence – One of the interesting trends that Amalgam Insights noticed in our inquiries was that Google Cloud replaced Microsoft Azure as the #2 cloud for new projects behind the market leader Amazon. In general, there was interest in using the right cloud for the job. Also, the cloud failures of leading vendors allowed Oracle Cloud to start establishing a toehold as its networking and bare-metal support provided a ramp for mature enterprises seeking a path to the cloud. As I’ve been saying for a decade now, the cloud service provider market is going the way of the telcos, both in terms of the number of vendors and the size of the market. Public cloud is now is $350 billion global market, based on Amalgam Insights’ current estimates, which measures to less than 7% of the total global technology market. As we’ll cover in our predictions, there is massive room for growth in this market over the next decade.
SD-WAN continues to be a massive growth market – From a connectivity perspective, Software Defined Wide Area Networks (SD-WAN) continue to grow due to their combination of performance and cost-cutting. This market saw 40% growth in 2021 and now uses security as a differentiator to get past what people already know. From an IT cost management perspective, this means that there continues to be a need for holistic project management including financial and resource management for these network transformation projects. Without support from technology expense management solutions with strong network inventory capabilities, this won’t happen.
As we can see, there were a variety of key IT trends that affected technology expenses and sourcing in 2021. In our next blog on this topic, we’ll cover some of our expectations for 2022 based on these trends. If you’d like a sneak peek of our 2022 predictions, just email us at info@amalgaminsights.com
Yesterday, January 6, Alteryx announced that it has acquired Trifacta for $400M in a cash offer. Trifacta and Alteryx have historically been viewed as competitors, but Trifacta’s greater depth of capability re data engineering and cleansing complements Alteryx’ strengths in analytic workflows.
Today, January 7, Meta debuted Audio-Visual Hidden Unit BERT (AV-HuBERT), a self-supervised framework for understanding speech that combines video input from lip movements and audio input from speech, both as raw unlabeled data. The goal is to improve accuracy even in environments where audio input may be compromised, such as from loud background noise.
On Thursday, January 6, Qlik announced that it had confidentially submitted its draft regulation statement related to a proposed IPO. The expected IPO comes over five years after private equity investment firm Thoma Bravo purchased Qlik and took them private.
On Wednesday, January 5, Fractal, an AI and advanced analytics provider, announced that TPG, a global asset firm, will be investing $360M in Fractal. Puneet Bhatia and Vivek Mohan of TPG will join Fractal’s board of directors as part of the deal.
WEKA, a data storage platform, announced on Tuesday, January 4, that they have raised $73M in a Series C funding round, raising total funding to $140M. The oversubscribed round was led by Hitachi Ventures. Other participants include Cisco, Hewlett Packard Enterprise, Ibex Investors, Key 1 Capital, Micron, MoreTech Ventures, and NVIDIA. The funding will go towards accelerating go-to-market activities, operations, and engineering.
Finally, Wednesday, January 5, Databricks announced that it had appointed Naveen Zutshi as their new Chief Information Officer. Zutshi joins Databricks from Palo Alto Networks, where he was the CIO for six years, expanding Palo Alto Networks into new security categories and scaling up at speed. Prior to that, Zutshi was the SVP of Technology at Gap Inc, overseeing global infrastructure, ops, and security for the retailer.